
THE FUZZY BURNED AREA MAPPING ALGORITHM
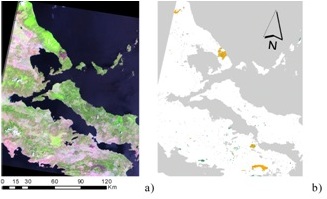 IREA-CNR has developed a burned area mapping fuzzy algorithm based on Spectral Indices (SIs), soft computing techniques and a region growing algorithm (Stroppiana et al., 2012). The algorithm has been specifically developed over Mediterranean regions and it aims at exploiting uni-temporal Landsat TM/ETM+ images for mapping the area affected by fires. The algorithm tested over independent data produced results with <3% and <21% omission and commission errors, respectively. In the figure, the false color composite (RGB-543) TM image is compared to the accuracy of the burned area map (orange=correct burned, white=correct unburned, green=commission, blue=omission).
Although optical satellite sensors provide reliable and consistent results for mapping burns, the presence of clouds could limit the frequency of surface observation. Satellite radar sensors allow overcoming this drawback and effectively complementing optical information. In particular, Synthetic Aperture Radar (SAR) is a coherent active microwave remote sensing system, which is able to retrieve information on the scattering properties of the Earth’s surface by transmitting a series of electromagnetic pulses and recording the signal that is reflected by the ground and returns to the receiving antenna. Since they provide their own illumination, SAR sensors can image in daylight or at night, in all-weather and environmental conditions, ensuring a continuous mapping and monitoring of burned areas.
INTEGRATION OF SAR DATA INTO THE FUZZY ALGORITHM
To take advantage of these characteristics, IREA-CNR, with the collaboration of the Forest Research Centre, University of Lisbon, has been testing the feasibility of integrating SAR data into the fuzzy algorithm (Azar et al., 2013), over Portugal and for the year 2003. For this purpose, time series of Landsat TM and ESA ENVISAT ASAR images (CAT-1 nr. 11779) have been acquired.
| Source | Sensor | Date | Area | Frame |
| Optical | Landsat TM | 12/08/2003 | Central Portugal | 204/032 (path/row) |
| Optical | Landsat TM | 24/10/2003 | Southern Portugal | 203/034 (path/row) |
| Radar | ENVISAT ASAR | 11/05/2003; 24/08/2003 | Central Portugal | 180-2807 (track-frame) |
| Radar | ENVISAT ASAR | 04/05/2003; 26/10/2003 | Southern Portugal | 87-746 (track-frame) |
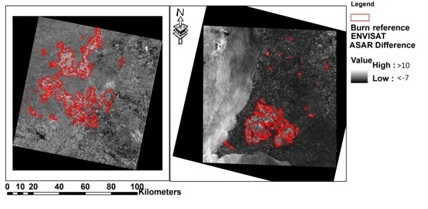 The figure shows difference between post- and pre- fire s° images (Δσ°post-pre) generated by processing ENVISAT data . Results show a good agreement with reference fire perimeters for 2003 (red polygons), derived from the Landsat based Fire Atlas of Portugal (Pereira, J.M.C. and Santos, M.T.N., 2003, Fire Risk and Burned Area Mapping in Portugal. Direcção-Geral das Florestas, Lisboa). Subsequently, Δσ° maps have been exploited to extract statistics over unburned and burned areas and to define the fuzzy membership functions of the positive and/or negative evidence.
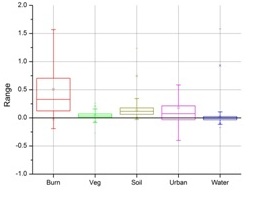
The boxplot (Δσ° on the y-axis) shows that σ° for burned areas (red) is characterized by an increase due to the effect of fire on vegetation. Unburned surfaces show, on the contrary, a stable signal (small difference between pre and post fire images) with constant median values; soil and urban areas are characterized by a median value slightly above zero. These analyzes are preliminary for the definition of the fuzzy function which is on going work.
Our research efforts are addressed to enhance wildfire monitoring capabilities by integrating optical and SAR data and achieve a more robust approach for mapping burned areas, thus contributing to the natural resources protection. Our challenge is to build a tool based on the fully exploitation of the characteristics and strength of optical and SAR sensors. Moreover, our research activities lay the foundation for exploiting future ESA Sentinel 1 and 2 missions.